|
2400 words; 10 minute read. A Mistake Do people tend to be overconfident? Let’s find out. For each question, select your answer, and then rate your confidence in that answer on a 50–100% scale:
First, the test is difficult: it’s likely that only one or two of your answers are correct. Second, your confidence in your answers probably does not reflect that degree of difficulty: I’ve given the test to 50 people, and their average confidence in their answers was 64%—yet only 44% of those answers were correct. When we look closer, this discrepancy between confidence and accuracy only becomes more striking. Question: of the claims people were 90%-confident in, what proportion were true? It is natural to think that if they are assessing their evidence properly, the answer will be “90%”. More generally, we might expect rational people to be calibrated: exactly 50% of the claims that they’re 50%-confident in are true; exactly 60% of the claims that they’re 60%-confident in are true, etc. Are people calibrated on this test? Not even close. For instance, of all the claims people were 90% confident in, only 63% were true. We can represent this and other discrepancies in a graph—called a calibration curve—where the x-axis represents degrees of confidence and the y-axis represents the proportion of the answers at that degree of confidence that were true. For instance, the point (0.9, 0.63) represents the fact that of all the claims that people were 90%-confident in, 63% were true. If someone is calibrated, this graph will be a diagonal line. How does that line compare to people’s actual calibration curve on my survey? Take a look: 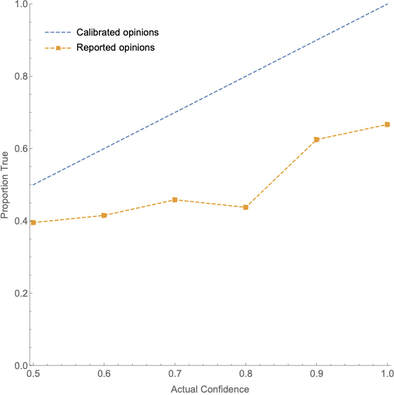 Fig. 1: Calibration curve for my survey. Yikes. What to make of results like that? Most psychologists take them to provide evidence that people are systematically overconfident in their opinions (summaries: here, here, and here). After all, if people are correct in their opinions far less often than they expect to be, then it's natural to infer that they are irrationally overconfident in those opinions. That inference—from “you are correct less often than you expect” to “you are irrationally overconfident”—forms the basis of the (much) repeated claim that people are systematically overconfident in their opinions. That claim has been a key component in the broader cultural narrative of irrationality, and has been cited as a driver of a raft of societal ills—including bad health habits, business failures, market bubbles and crashes, political polarization, intolerance, and even wars. As one textbook puts it: “No problem in judgment and decision-making is more prevalent and more potentially catastrophic than overconfidence” (Plous 1993, 213). But the inference rests on a mistake. More precisely, it is a mistake to infer simply from a calibration curve like the one I showed you to the conclusion that subjects were overconfident in their opinions. Since this inference undergirds the general conclusion about overconfidence, it is not at all clear that we have genuine evidence that people tend to be overconfident. Now, I think there is something importantly right about the inference (for the full story, see the paper this post is based on). But here I’m going to focus on what’s wrong with it—on why the studies we’ve been running do not, as they are currently constructed, provide a genuine test of overconfidence. How Not What exactly are the results of those studies? The most widely-cited finding is what’s known as the “hard-easy effect“. We can categorize a test based on its hit rate—the proportion of all subjects’ answers that are true. Say that a (binary-choice) test is hard if it has a hit rate of less than 75%, and easy if it has a hit rate of at least 75%. The hard-easy effect is that on hard tests people’s confidence tends exceed the proportion true (hence their calibration curve is to the right of the diagonal line––see the bottom lines in the below graph), whereas on easy tests the proportion true often exceeds their confidence (hence their calibration curve is to the left of the diagonal line––see the top lines): 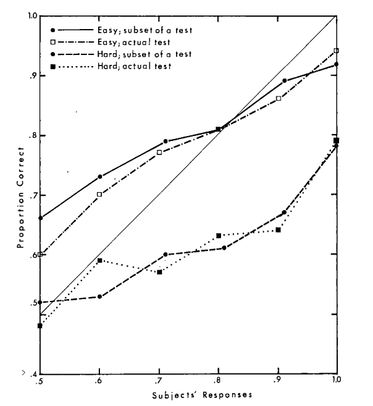 Fig. 2: Calibration curves for easy tests (top curves) and hard tests (bottom curves). Figure from Lichtenstein, Sarah, Fischhoff, Baruch, and Phillips, Lawrence D., (1982). ‘Calibration of probabilities: The state of the art to 1980’. In Daniel Kahneman, Paul Slovic, and Amos Tversky, eds., Judgment under Uncertainty, 306–334. Cambridge University Press. Reproduced with permission of the Licensor through PLSclear. The standard interpretation of this effect is that people fail to take difficulty into account, and therefore become overconfident on hard tests and under-confident on easy tests. Is that a sensible interpretation? To evaluate it, we need to be clear on what it means to say that you are “overconfident.” It does not simply mean that your average confidence in your opinions exceeds the proportion of those opinions there are true. For example: even though people’s average confidence on my test was 64% and the proportion true was 44%, it's still possible that they were fully rational. Consider an example. I have a coin that is 60% biased toward heads, and I’m about to it 10 times. How confident are you, of each toss, that it’ll land heads on that toss? 60%, no doubt. Now I toss the coin… and (surprisingly) it turns out it landed heads only 3 of 10 times—so only 30% of the opinions that you were 60% confident in were true. Does that mean you were overconfident? Of course not—your 60% confidence was perfectly rational given your evidence about the coin; it just so happened that you got unlucky with how the coin landed. The point? There is a difference between rational degrees of confidence and calibrated degrees of confidence. In saying that you are “overconfident”, we are presupposing that there is some degree of confidence––R––that it would be Rational you to have, and that your actual opinion is more extreme than R. Once we make this conceptual point, it’s clear that there is no necessary connection between the (average) rational confidence on a test and the proportion of claims on the test that are true. In fact, by manipulating the construction of the test, we can distort that connection as much as we like. Consider Calvin. Suppose that, given his evidence (memories, general knowledge, etc.) the rational confidence for him to have in the following claims—i.e. R—is as follows:
This procedure is fully general. Take any test you like, and suppose that Calvin’s rational degrees of confidence would be calibrated on it. Then as we start to remove true claims from the test, his rational confidence will start to exceed the proportion true—both will tend toward 0%, but the latter will do so much faster. Conversely, if we start to remove falsehoods from the test, both is confidence and the proportion true will tend toward 100%, but again the latter will do so much faster. Either way, he’ll become substantially miscalibrated. First upshot: Miscalibration is not good evidence for irrationality, since fully rational people will often be miscalibrated––especially on tests that contain a high (or low) proportion of truths. Second upshot: Therefore, we cannot test whether people are overconfident by simply testing whether their calibration curves deviate from the diagonal-line calibrated one, as is standardly done. How, then, can we test for overconfidence? How To To do so, we need to know what to expect a rational person’s calibration curve to look like on a test with a given hit rate. Here’s a helpful analogy. Suppose we have a variety of coins of different biases: some are 90% likely to land heads on a given toss, others 80%, and so on. Suppose we’ve tossed these coins lots of times and written down the bias of the coin on one side of a piece of paper, and the way it landed on the other. Now we collect a sample of these slips of paper, show the bias-indicating side of each slip to our subject Bianca, and have her announce her guess as to whether the coin landed heads or tails along with her confidence in that guess. After doing this, we plot her calibration curve. The analogy: the bias of the coin is like the evidence that Calvin has about the questions on his test; the fact that Bianca knows the biases is analogous to Calvin knowing the rational confidence R for him to have in each claim; the ways of collecting the slips of paper correspond to different ways of constructing the test. Finally, note that it is not realistic to suppose that a person like Calvin is always perfectly rational in setting his degrees of confidence—it is far more plausible to suppose that he tends to be rational, but with some random error. To make Bianca’s case analogous, let’s suppose that the bias of the coin is indicated on the slip of paper by an unmarked slider, like this one which indicates a 60% bias toward heads: 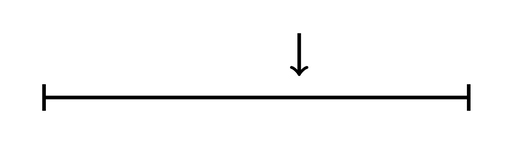 So given just the quick glance she’s afforded, Bianca is pretty good (but not perfect) at recognizing the bias of the coin. Given this setup, what should we expect Bianca’s (and, by analogy, a rational subject like Calvin’s) calibration curve to look like on various tests? We can simulate it. Suppose the slips of paper are randomly drawn from all tosses of the coins. Given that, what should we expect Bianca’s calibration curve to look like on (1) a randomly selected test, (2) a random test that turns out to be easy (high hit rate), and (3) a random test that turns out to be hard (low hit rate)? Here are the results from a simulation of 50,000 trials, averaging her calibration curves within each category (1)–(3): 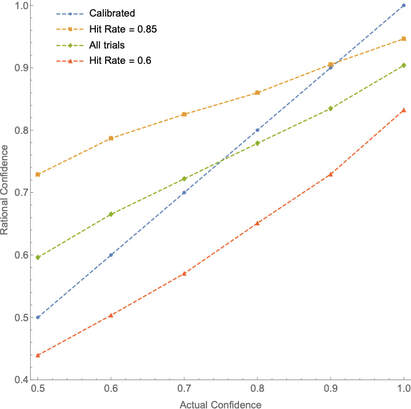 Fig. 3: Simulation from random tests. As you can see, over all trials (green line) Bianca is roughly calibrated—though at the end-points of the scale, the curve is tilted due to “scale-end effects” (her errors in identifying the bias can only go in one direction). Nevertheless, we see a realistic hard-easy effect: of the hard tests (red line), Bianca’s confidence exceeds the proportion of truths; of the easy tests (orange line), her confidence is exceeded by it (except at the top end). Upshot: Since Bianca’s case is analogous to Calvin’s, we can see that rational people would exhibit a hard-easy effect very similar to the one that’s empirically observed. (Compare the orange and red lines of Figure 3 to the top and bottom lines of Figure 2.) Why? Because when we focus in on test with low (or high) hit rates, there is a selection effect that Bianca cannot account for. Suppose we take a test that happened to have a low hit rate. Why was it low? One explanation is that our slips of paper happened to correspond to coins with moderate biases (close to 50%), and so were harder to predict. A different explanation is that even amongst the coins with a strong bias, fewer of those landed heads than you would normally expect (perhaps only 60% of the 70%-heads-biased coins landed heads). In any given test with a low hit rate, it’s likely that both of these factors are at play. And although Bianca can be sensitive to the first factor by recognizing that most of the biases of the coins are moderate, she cannot be sensitive to the second factor. As a result, as the hit rate becomes more extreme, she becomes less calibrated. For example, the average hit rate over all trials was 75% and Bianca’s average confidence was 75%; but amongst tests on which the hit rate was 60%, Bianca’s average confidence only fell to 73.3%; and amongst tests on which the hit rate was 85%, Bianca’s average confidence only rose to 76%. Likewise, of course, for Calvin: even rational people facing randomly selected test questions will display a form of the hard-easy effect. With this in mind, let’s revisit my test. If we run this simulation with the observed hit rate of 44% and graph the predicted rational calibration curve (green line) against the empirically observed on (orange line), here’s what we get: 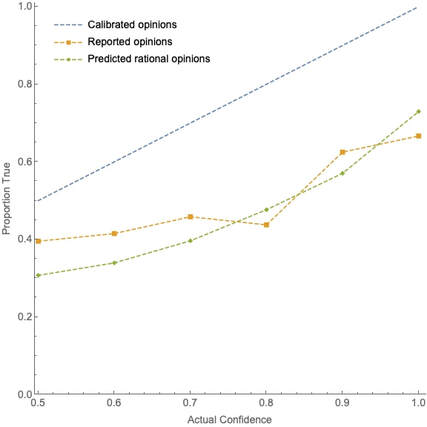 Fig. 4: Predicted rational calibration curve on my survey Upshot: as I said, the observed miscalibration on my test is not evidence that my subjects were irrational––in fact, a rational person should be expected to have a very similar calibration curve.
What to make of all this? I think it means that the current methodology for testing for overconfidence is untenable. This methodology involves assuming that a rational person will be calibrated on the test, and then seeing whether real people deviate from this. As we’ve seen, that is a mistake: even rational people will be systematically miscalibrated on tests that are hard or easy. (Similar morals apply, I think, to other empirical effects––see the full paper.) Thus to make a genuine test of overconfidence we must first predict the rational deviations from calibration on our test, and then compare real people’s performance to that prediction. As we’ve seen, doing so has the potential to reverse our interpretation of the data. Perhaps we've been too confident that people tend to be overconfident. What next? If you want more of the details, check out the full paper here. If you’re an academic working on these topics and would like to chat—including to point me to parts of the literature that I may have misunderstood, or simply missed—please reach out to me! If you want to play with the simulators yourself, here are two I’ve posted online. This subject-matter simulator simulates both fully random questions, as well as those pulled from subject-matters that have random degrees of misleadingness. This scrutinized-question simulator simulates a test where questions are scrutinized for their difficulty before it is decided whether they are included. For more details about these simulations, see §5 of the full paper. PS. The answers are: Madrid; the printing press; a home-run lap. PPS. Thanks to Cosmo Grant for feedback on this blog post, and many others for feedback on the full paper.
10 Comments
Peter Gerdes
2/19/2020 12:40:05 pm
I thought the whole idea of calibration (and what is rationally required) is to be calibrated on the types of questions you regularly encounter in some domain (presumed to be of similar levels of importance or at least no systemic correlation between importance and truth-value).
Peter Gerdes
2/19/2020 12:51:22 pm
If I’m being charitable I'd say the background assumption the papers are making is something like:
Kevin
2/19/2020 03:05:38 pm
Thanks for your question! Let me see if I understand your concern. The argument I was trying to make here is that *even if* the questions are randomly selected, we shouldn't expect rational people to be calibrated when we focus in on tests of different difficulty. (That's what was happening in my simulations; there are alternatives given in the paper where we don't assume the tests are random, with even more extreme results.)
Peter Gerdes
2/21/2020 05:27:24 am
That's close but not quite the way I was thinking of it.
Kevin
2/23/2020 06:06:15 am
Got it, yes that seems like a fair question/concern!
Peter Gerdes
2/21/2020 05:29:02 am
BTW I’m a bit bothered by people's inability to put together fact that football field is 100 yards and baseball diamond is square 90 foot on a side to answer final question.
Peter Gerdes
2/21/2020 05:41:07 am
Oops didn't mean this quote below. I meant that in a context where you look at the data about calibration responses it's easy to adjust this variable and call it identifying a subject/question type people are overconfident. I don't mean to contradict claim later in comment that in daily life it's not easy to affect by accident. Just that selecting a subset of questions because you think they'll give an interesting publication can affect this.
Kevin
2/23/2020 06:07:09 am
Ha, I take it that they simply don't know that a baseball diamond is 90 feet per side :) Leave a Reply. |
Kevin DorstPhilosopher at MIT, trying to convince people that their opponents are more reasonable than they think Quick links:
- What this blog is about - Reasonably Polarized series - RP Technical Appendix Follow me on Twitter or join the newsletter for updates. Archives
June 2023
Categories
All
|
 RSS Feed